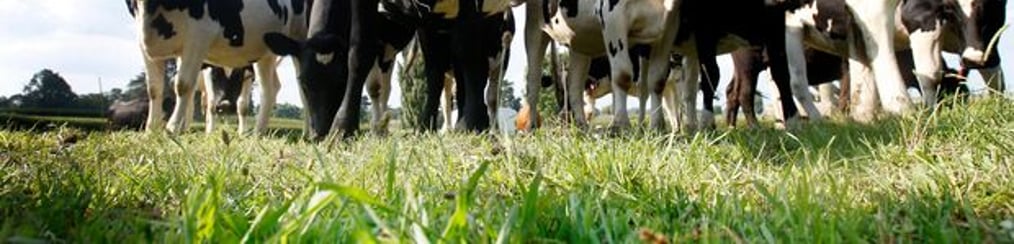
Below are the summarised results of the dry matter estimation of a chicory pasture carried out on a dairy farm in Hamilton New Zealand in January 2012 comparing the use of a GrassMaster (GMII) pasture meter and a standard Rising Plate Meter (RPM).
The pasture was largely Chicory (juvenile) mix plus a small amount of ryegrass.
The measured quadrat plots were 0.2m2, or 44.72cm inside x 44.72cm
Each quadrat was measured by means of one RPM plate reading and the average of 9 x GM readings (probes). Linear equations (using linear regression) were derived for each measurement insrutment.This entailed recording the number clicks for the RPM and CMR values (corrected meter readings) in the case of the GrassMaster probe against calculated Cut Weigh and Dry (CWD) vlaues for each of the quadrats.
A total of ten plots were evaluated on the day, quadrats 1-6 being pre grazing and quadrats 7 - 10 being post grazing situations.
The Grass and Chicory were sorted and seperately oven dried for dry matter % determination (av 20%DM Grass) and (av 10%DM -Chicory).
Below are summarised results comparing CWD against the RPM and GM measured values with the error of each method compared against CWD for each plot
| Quadrat Number | Dry Matter% | Cut Weigh and Dry Matter Yield | RPM predited | Error | GM predicted | Error |
| kg DM/ha | kg DM/ha | Error kg | kg DM/ha | Error kg | ||
| 1 | 12.41 | 3845 | 4016 | 171 | 3855 | 10 |
| 2 | 12.06 | 2770 | 2490 | 280 | 2828 | 58 |
| 3 | 18.41 | 2735 | 3067 | 332 | 2687 | 48 |
| 4 | 9.41 | 3315 | 2655 | 660 | 3317 | 2 |
| 5 | 20.02 | 2025 | 1665 | 360 | 1948 | 77 |
| 6 | 16.44 | 2070 | 2283 | 213 | 2063 | 7 |
| 7 | 14.8 | 1215 | 1500 | 285 | 1294 | 79 |
| 8 | 14.8 | 1220 | 1458 | 238 | 1306 | 86 |
| 9 | 14.8 | 1365 | 1376 | 11 | 1264 | 101 |
| 10 | 14.8 | 1325 | 1376 | 51 | 1322 | 3 |
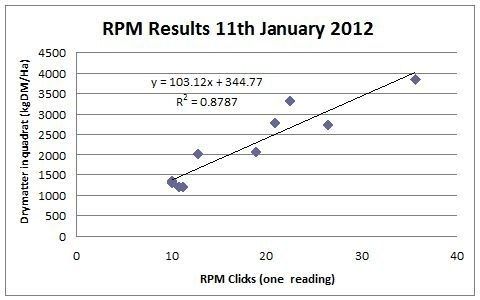
Below are graphical representations of the derived linear relationships between machine readings and CWD for each plot in a y=mx+c format
R2 values are also given. R2 are statiscal indicators of 'how tight' the raw data fits the derived equation. A R2 value of 0.7 or greater would normally indicates a 'good strong relationship' with a R2 value of 1.0 being perfect.
As can be seen, both the Rising Plate Meter and the GrassMaster deliver very good results with the GrassMaster exhibiting a near perfect relationship.
The very tight relationship (ie high R2 values) that the GrassMaster consistantly displays between the 'predicted' CMR (Corrected Meter Readings) values generated by the GrassMaster with 'actual' values as calculated from CWD (Cut Weigh and Dry) sampling has made the GrassMaster a favoured instrument for non-destructive sampling in pasture trial work by research agronomists and pasture seed development orgnisations world wide
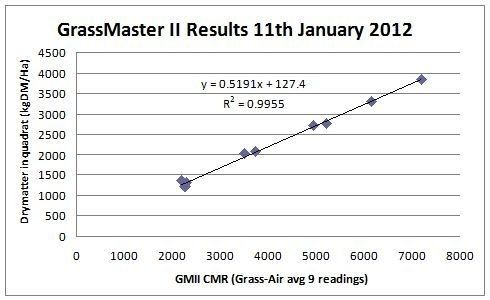
A simple linear regression of CMR values (x axis in above GrassMaster II chart and Dry matter in quadrat - as calculated from Cut Weigh and Dry sampling of the quadrat results in a simple linear equation of a y= mx +c format, in this instance y= 0.519 + 127 where y= the kg DM/ha predicted by the GrassMaster. For improved predictive accuracy, such a new equation might then be entered into the GrassMaster to overwrite its default equation . Such an instnace might be justifed at different times of the year when the dry matter % of the pasture changes considerably, or when different pasture species to ryegrass /clover mixes are being measured.
The same argument would apply to the Rising Plate Meter and all other non-destructive forms of pasture measurement.